Heel Fatigue Tester is used to determine the resistance of medium and high heels of ladies’ shoes un
WhatsApp : +86 13816217984
Email : info@qinsun-lab.com

Heel Fatigue Tester is used to determine the resistance of medium and high heels of ladies’ shoes under repeated small impacts to the heel tip.
The heel fatigue tester is used to determine the resistance of medium and high heels of ladies’ shoes under repeated small impacts to the heel tip.
Clamp the heel on the machine, adjust the height position and angle of the heel according to the equipment, adjust the hammer in the horizontal position, pre-set the number of impacts, start the equipment. The hammer would impact the heel with the specified energy of 0.68J, 60 cycles per minute. Continuous testing until the heel breaks or reaches the specified number of impacts, the equipment automatically stops, and the number of impacts is recorded. This test method is used to assess the resistance of the heel to the repeated impact with certain mass.
A heel is subject to blows of specified energy, delivered by a pendulum under a specified frequency, testing continues until failure of the heel takes place or satisfactory fatigue resistance is achieved.
Impact Energy:0.68J / blow
Impact Frequency:60 blows /min
Adjustable Range of Base Clamp:90mm (H), 80mm (W), angle 0~180°
Counter LCD:0~999,999
Main unlt:46×46×75cm
Control box:18×21×20cm
Weight:70kg
Power Supply:1∮ AC 220V,3A
BS-5131 4.9,
ISO 19956
SATRA TM21,
QB/T2864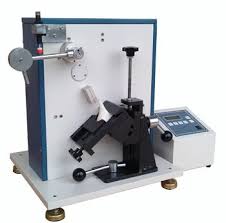
Qinsun Instruments Co., LTD is a professional laboratory testing instrument manufacturer in China,Have been focusing on laboratory instrument R&D more than 30 years and have rich industry experience,Based on international testing standards,We are also the instrument supplier for BV SGS laboratory,We provide one-stop solutions for lab instruments,Free Training and Turn-Key Service,Products exported all over the world,Offer 36 month warranty and are a trustworthy partner.

Company Phone
+86-21-6420 0566
Working hours
Monday to Friday
Mobile phone:
13816217984
Email:
info@qinsun-lab.com